Back to myNiagaraOnline


Developed using data from the Multiple Listing Service®, the MLS® Home Price Index (or MLS® HPI for short) allows us to see trends in home prices for a specific type of house in any given neighbourhood in Niagara.
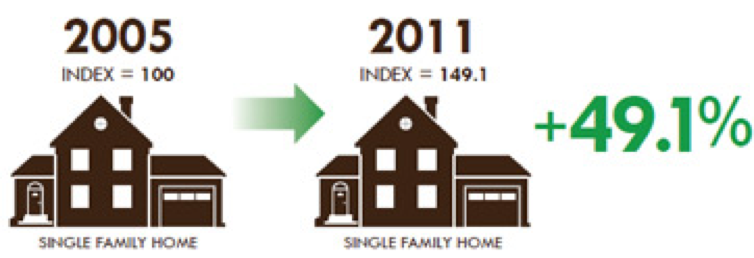
The MLS® HPI tracks changes in home prices by comparing price levels at a point in time with price levels in a base (reference) period. The base period value is always 100.
For example, if the base period for single-family homes is 2005, and the MLS® HPI value for single-family homes in December 2011 is 149.1, you know that the value of single-family homes is up 49.1%, compared with 2005 (149.1 − 100 = 49.1%).
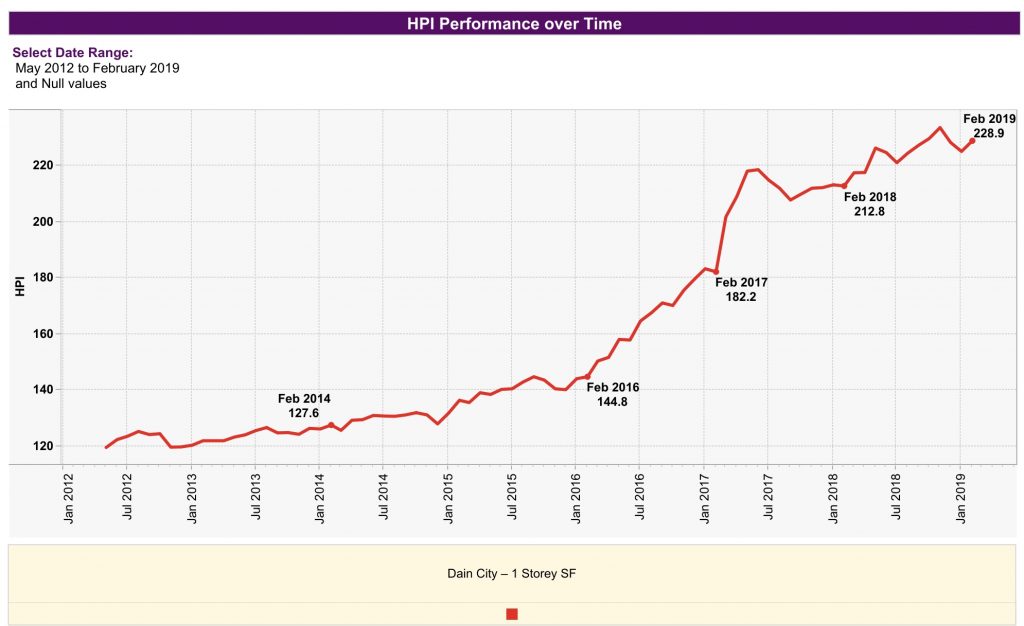
Here is a quick graph that we created that illustrates the price performance trends in Dain City to show how the calculation works using Bungalows as an example.
Curious to know more the price performance in your neighbourhood for any time period since 2005 give us a call. We would be happy to run the numbers for you!
If you are planning a move or perhaps thinking of buying an investment property, now is the right time to get a head start with our prime selling season just around the corner.
Please don’t hesitate to reach out to us anytime If we can be of any assistance in moving your plans forward.
We’re here to help,
John & Cathy
 |
|
||||||||||||||